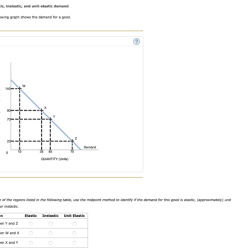
The Following Graph Shows The Demand For A Good.
The following graph shows the demand for a good. This graph illustrates the relationship between the price of a good and the quantity demanded. The demand curve slopes downward, indicating…
Read more »